Self-Tracking For Panic: A bash-ful Look At Some Data
In this post, I perform initial exploratory analysis on my panic recovery journal data using basic UNIX/bash commands.
UNIX? bash? You're not serious, right? #
Most of the data-centric Quantified Self talks I've seen focus on more complicated methods, including:
- linear regression, which identifies gradual trends;
- FFT, which identifies periodic effects;
- Pearson's r, which measures correlation between datasets;
- t-test, which measures difference between datasets.
These are extremely powerful tools to have at your disposal. Better yet, many languages have community-contributed libraries that provide these tools out-of-the-box. For instance, Python's scipy offers linregress for performing linear regression.
That said, these tools rely on mathematics that is opaque to many software developers. Even if you don't need to know how they work to use them, you need some knowledge of what they do and where they are most appropriate. Statistical tests in particular often have strong preconditions for use:
Each of the two populations being compared should follow a normal distribution.
Even if you pick the right tool, there's still fear associated with losing control. These tools are not hammers and screwdrivers but magic wands, and we are terrible magicians.
A Word On Exploratory Analysis #
I mentioned that this post would demonstrate exploratory analysis. This is a mode of analysis where you explore your data, play around with it a bit, grab some low-hanging analytical fruit. You don't necessarily need higher mathematics. Regular counts and averages will do. You're not looking for ironclad proof, but rather for suggestions.
What does this data suggest?
This is an important question. Put this way, there is no "right" or "wrong" way to analyze your data. UNIX tools fit in nicely here, because you can piece them together and pretty quickly get some useful insights. Better yet, since you understand what you just did, you can explain it to someone else. Analysis becomes a demystified and shareable process.
Exploratory analysis is also a great entry point to deeper and more directed analysis. As you work with the data, you ask more complicated questions. Eventually these questions exceed the sophistication of your tools, so you look for better tools. You might not deeply understand the better tools, but at least you've worked with the data a bit. You can perform basic sanity checks when these better tools turn up results you don't expect.
The Data #
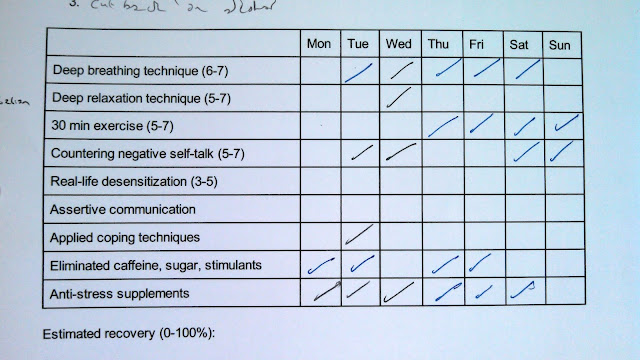
I took my paper recovery journal logs:

and manually converted them to handy CSV files:
date,relaxation,exercise,diet,supplements
...
2012-03-12,0,0,1,1
2012-03-13,1,0,1,1
2012-03-14,1,0,0,1
2012-03-15,1,1,1,1
2012-03-16,1,1,1,1
2012-03-17,1,1,0,1
2012-03-18,0,1,0,1
...
Where did all those different treatments go? I didn't end up using most of them. Making nine parallel habit changes is difficult, so I rapidly converged on a subset of four:
- relaxation breathing;
- daily exercise;
- dietary modifications; and
- vitamin supplements.
Why manual input? There wasn't enough data to make OCR worthwhile:
$ cd recovery-journal
$ wc -l * | grep total
      41 exercise-record
      46 food-diary
       8 panic-log
      46 weekly-practice-record
     141 total
You can view and download the raw data files here.
Common Operations #
These operations appear several times in the UNIX one-liners below, so let's go over them quickly.
To lop off the CSV column name header:
tail -n+2To extract field $ n $ from a CSV file:
cut -d',' -f$nTo tabulate counts in descending order:
sort | uniq -c | sort -rnTo sum a series of numbers:
awk '{sum+=$1} END {print sum}'To get the day before $ds:
ts=$(date -j -f "%Y-%m-%d" $ds "+%s"); tsprev=$(echo "$ts - 86400" | bc); dsprev=$(date -j -f "%s" $tsprev "+%Y-%m-%d");And Now, The Main Show #
Let's start by looking at my weekly practice record:
$ for a in [01] 1; do for b in [01] 1; do for c in [01] 1; do for d in [01] 1; do count=$(grep -E ",$a,$b,$c,$d$" weekly-practice-record | wc -l); echo $a $b $c $d $count; done; done; done; done | tr ' ' '\t'
[01]    [01]    [01]    [01]    45
[01]    [01]    [01]    1       43
[01]    [01]    1       [01]    22
[01]    [01]    1       1       21
[01]    1       [01]    [01]    32
[01]    1       [01]    1       31
[01]    1       1       [01]    16
[01]    1       1       1       16
1       [01]    [01]    [01]    36
1       [01]    [01]    1       34
1       [01]    1       [01]    19
1       [01]    1       1       18
1       1       [01]    [01]    26
1       1       [01]    1       25
1       1       1       [01]    14
1       1       1       1       14
I tracked myself for 45 days. During that time, I followed all four treatments on 14 days. In order from most to least regular:
- vitamin supplements (43 days);
- relaxation breathing (36 days);
- daily exercise (32 days);
- dietary modifications (22 days).
I followed both the exercise and diet treatments for only 16 of 45 days! Right away, I have a question for further inquiry:
What was so hard about those two treatments?
Exercise #
$ tail -n+2 exercise-record | cut -d',' -f2 | sort | uniq -c | sort -rn | head -5
  11 16:00
   8 20:00
   3 15:00
   3 14:00
   3 12:00
My most common exercise times were 4pm and 8pm. What was I doing at those times?
$ grep 16:00 exercise-record | cut -d',' -f3 | sort | uniq -c | sort -rn | head -1
   9 conditioning
$ grep 20:00 exercise-record | cut -d',' -f3 | sort | uniq -c | sort -rn | head -1
   6 soccer
Aha! 4pm was my scheduled gym time at work, and 8pm was when I went for weekly pickup soccer. Both were regularly scheduled activities.
$ grep -E "(00|01|02|03|04|05|06|07|08|09|10|11):00" exercise-record | wc -l
       7
$ grep -E "(12|13|14|15|16|17|18|19|20|21|22|23):00" exercise-record | wc -l
       33
I rarely exercise in the morning, which might be okay: physical performance is higher in the afternoon.
$ tail -n+2 exercise-record | cut -d',' -f3 | sort | uniq -c | sort -rn
  15 conditioning
   7 soccer
   6 walking
   6 cycling
   2 running
   2 dancing
   1 swimming
   1 longboarding
It's not surprising to see gym conditioning sets and soccer as my top activities, but walking and cycling aren't far behind.
$ tail -n+2 exercise-record | cut -d',' -f4 | sort | uniq -c | sort -rn
  20 30
  11 60
   4 45
   2 40
   2 240
   1 120
I most commonly exercised for 30-60 minutes, with infrequent longer blocks of activity. What was I doing in those longer blocks?
$ grep -E ",(120|240)$" exercise-record
2012-01-27,20:00,dancing,120
2012-01-29,10:00,walking,240
2012-02-11,12:00,walking,240
When else was I dancing?
$ grep dancing exercise-record
2012-01-27,20:00,dancing,120
2012-02-03,21:00,dancing,30
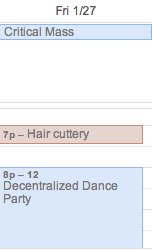
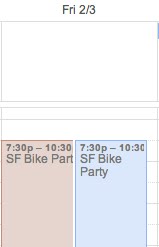
Looking at my calendar, these blocks are easily identified:


Having fun is great for my health!
Diet #
$ for i in $(seq 2 5); do count=$(cut -d',' -f$i food-diary | awk '{ sum+=$1} END {print sum}'); name=$(head -1 food-diary | cut -d',' -f$i); printf "%12s\t%s\n" $name $count; done
    caffeine    6
      sweets    48
     alcohol    140
 supplements    42
I nearly eliminated caffeine during this period! By the time I started keeping the log, I'd already started to reduce my consumption. On average, I had just over one sweet per day. More troubling is alcohol, with an average of 3.1 drinks/day. Let's take a closer look at my drinking patterns.
$ tail -n+2 food-diary | cut -d',' -f4 | sort | uniq -c | sort -rn
  12 4
   9 2
   7 1
   6 5
   3 3
   2 8
   2 6
   2 0
   2
My most common daily drinking amounts were 1, 2, and 4 drinks per day. It was very rare for me to go a day without drinking any alcohol. More alarmingly, binge drinking counts for over 40% of my alcohol consumption!
$ tail -n+2 food-diary | while read line; do weekday=$(date -j -f "%Y-%m-%d" $(echo $line | cut -d',' -f1) "+%a"); alcohol=$(echo $line | cut -d',' -f4); echo $weekday $alcohol; done > drinking.log
$ for weekday in Mon Tue Wed Thu Fri Sat Sun; do count=$(grep $weekday drinking.log | cut -d' ' -f2 | awk '{ sum+=$1} END {print sum}'); echo $count $weekday; done | sort -rn
28 Wed
27 Sat
23 Mon
20 Sun
19 Fri
15 Tue
8 Thu
I drank most on Wednesdays and Saturdays; Mondays were also major drinking days, which is surprising! By contrast, I drank much less than average on Thursdays. When I narrow in on binge drinking, the pattern shifts slightly:
$ grep -E "(5|6|7|8)$" drinking.log | cut -d' ' -f1 | sort | uniq -c | sort -rn
   4 Sat
   3 Sun
   2 Wed
   1 Fri
Wednesday is still an offender, but the weekends are clear culprits. 80% of my binge drinking days fell on weekends.
$ tail -n+2 food-diary | cut -d',' -f1,4 | grep -E "(5|6|7|8)$" | while read line; do ds=$(echo $line | cut -d',' -f1); ts=$(date -j -f "%Y-%m-%d" $ds "+%s"); ts_next=$(echo "$ts + 86400" | bc); ds_next=$(date -j -f "%s" $ts_next "+%Y-%m-%d"); echo $line $(grep $ds_next food-diary | cut -d',' -f1,4); done
2012-01-21,5 2012-01-22,5
2012-01-22,5 2012-01-23,1
2012-01-28,8 2012-01-29,2
2012-02-01,6 2012-02-02,0
2012-02-04,5 2012-02-05,3
2012-02-10,6 2012-02-11,4
2012-02-12,5 2012-02-13,3
2012-03-14,8 2012-03-15,0
2012-03-17,5 2012-03-18,5
2012-03-18,5 2012-03-19,4
Among days where I had 5 or more drinks, I had an average of 2.7 drinks the next day.
$ tail -n+2 food-diary | cut -d',' -f1,4 | grep -E "(0|1)$" | while read line; do ds=$(echo $line | cut -d',' -f1); ts=$(date -j -f "%Y-%m-%d" $ds "+%s"); tsprev=$(echo "$ts - 86400" | bc); dsprev=$(date -j -f "%s" $tsprev "+%Y-%m-%d"); echo $(grep $dsprev food-diary | cut -d',' -f1,4) $line; done
2012-01-22,5 2012-01-23,1
2012-01-23,1 2012-01-24,1
2012-01-30,4 2012-01-31,1
2012-02-01,6 2012-02-02,0
2012-02-05,3 2012-02-06,1
2012-02-06,1 2012-02-07,1
2012-02-08,4 2012-02-09,1
2012-03-14,8 2012-03-15,0
2012-03-15,0 2012-03-16,1
Among days where I had fewer than 2 drinks, I had consumed an average of 3.6 drinks the previous day. This suggests a see-saw pattern: I would drink too much one day, back off the next, and repeat.
Panic #
All of this skirts the real question:
What caused me to have panic attacks?
$ for i in $(seq 2 4); do head -1 food-diary | cut -d',' -f$i; tail -n+2 panic-log | cut -d',' -f1 | while read ds; do ts=$(date -j -f "%Y-%m-%d" $ds "+%s"); tsprev=$(echo "$ts - 86400" | bc); dsprev=$(date -j -f "%s" $tsprev "+%Y-%m-%d"); echo $(grep $dsprev food-diary | cut -d',' -f1,2) $(grep $ds food-diary | cut -d',' -f1,$i) $ds; done; done
caffeine
2012-01-28,0 2012-01-29,0 2012-01-29
2012-01-31,0 2012-02-01,0 2012-02-01
2012-02-03,0 2012-02-04,0 2012-02-04
2012-02-07,0 2012-02-08,1 2012-02-08
2012-02-12,0 2012-02-13,0 2012-02-13
2012-02-29
2012-03-12,0 2012-03-13,1 2012-03-13
sweets
2012-01-28,0 2012-01-29,3 2012-01-29
2012-01-31,0 2012-02-01,1 2012-02-01
2012-02-03,0 2012-02-04,2 2012-02-04
2012-02-07,0 2012-02-08,1 2012-02-08
2012-02-12,0 2012-02-13,1 2012-02-13
2012-02-29
2012-03-12,0 2012-03-13,1 2012-03-13
alcohol
2012-01-28,0 2012-01-29,2 2012-01-29
2012-01-31,0 2012-02-01,6 2012-02-01
2012-02-03,0 2012-02-04,5 2012-02-04
2012-02-07,0 2012-02-08,4 2012-02-08
2012-02-12,0 2012-02-13,3 2012-02-13
2012-02-29
2012-03-12,0 2012-03-13,2 2012-03-13
I had no data for 2012-02-28. Other than that, on days where I had reported panic attacks, my current- and previous-day consumption patterns were:
- alcohol: 3.7 drinks that day, 3.8 the previous day (overall average is 3.1);
- sweets: 1.5 sweets that day, 1.0 the previous day (overall average is 1.0);
- caffeine: 0.3 caffeinated beverages that day, 0.0 the previous day (overall average is 0.1).
This suggests that reducing alcohol and sweets consumption does help. The data is less clear on caffeine; as previously mentioned, I had mostly cut out caffeine by the time I started tracking.
Up Next #
In the next post, I'll run some of the statistical tests and transformations mentioned previously on this same data. I'll also compare this dataset with another dataset gathered through qs-counters, a simple lightweight tracking utility I built to reduce friction in the recording process.
- Next: Self-Tracking For Panic: A Deeper Look
- Previous: Panic!