Track Your Happiness: An Adventure In Data Extraction
In this post, I go over my first report from Track Your Happiness, a tool that uses the Experience Sampling Method for mood tracking.
My Report #
Charts #
My happiness is relatively constant across days of the week.
I'm happiest at the gym or in parks, with vacations and restaurants close behind. "At Home" is mid-pack, with "At Work" near the bottom.
Fun, exercise, and food generate the most happiness. Passive actions such as watching TV, commuting, and waiting rank much lower. Work is least happiness-inducing.
Whether I want to perform a task is a much stronger determinant of happiness than whether I have to:
I'm happier when outside.
I'm happier when alone.
Given that, it seems counterintuitive that I'm happier when interacting with multiple people.
I was also surprised by this one: I'm happiest when talking with acquaintances or friends and least happy when talking with family.
What Does It Mean? #
Even without considering the specific results, I have a few unanswered questions:
- What is happiness? How do I judge it at a particular moment? Is my judgment accurate and consistent?
- Is it necessarily better to be happier, or is there a threshold past which additional happiness doesn't improve the quality of life?
- Are these results significant? They're computed from just 50 samples, which seems low for drawing such broad conclusions.
- Do these activities make me more or less happy, or do these readings reflect my pre-existing mental state?
There's also the issue of those surprising findings. Am I really less happy when talking with Valkyrie Savage? To me, the most likely explanation is trust: around her, I feel free to discuss negative aspects of my life. Doing so would necessarily involve fixating on those aspects, which could account for some happiness reduction.
During this period, I was confronting doubt and frustration in my job. According to my personal data, I was also drinking heavily, possibly as a means for coping with that negative emotion. (It doesn't help.) Guilt is a potential factor; perhaps I felt that I was always offloading that doubt and frustration onto her.
The problem, though, is that none of these explanations are testable. They seem reasonable to me, but from a scientific standpoint they fail a simple criterion:
Upon viewing only my data, would an impartial stranger reach similar conclusions?
I can't see how they would, since my explanations involve intricate self-knowledge that is not represented in the data.
A Further Note On Significance #
Let's take a more critical look at this chart:
I mentioned that this data was drawn from a total of 50 samples. I'm assuming that these bars represent average reported happiness in each category. But:
- Which average? Probably the mean, but that's not made explicit anywhere.
- Where are the error bars? I have no idea whether the ranking is significant.
- How many samples go into each bar? Maybe "Acquaintances" and "Other Relatives" are outliers because I rarely talk to people in those categories.
This leads to an important point:
Never present uncertain information as certain.
Digging Deeper #
Consider this chart:
Am I happier when I'm more focused? It's hard to tell from looking at this chart. This is a prime use case for linear regression, but I don't have the data! They claim to have plans for data export, but I haven't seen those come to fruition. What now?
Data Extraction #
Fortunately, the chart was generated using the (now deprecated) Image Charts functionality of the Google Charts API. With Image Charts, you make requests to specially encoded URLs:
https://chart.googleapis.com/chart
  ?chs=310x200
  &cht=s
  &chco=0088cc
  &chxt=x%2Cy
  &chxr=0%2C0%2C100%7C1%2C0%2C100
  &chxs=0%2C666666%2C10%7C1%2C666666%2C10
  &chd=s%3AaUXKPnmomsWw0tSQnXaVrk%2CslrjjuZtXvZotualhrmepm
You can see what all those parameters do here, but the one I really care about is chd. This encodes the chart data in the Simple Encoding Format. I'll walk through how to decode this data.
As it stands, the value of chd is URL-encoded. We need to decode those %3A and %2C escape sequences.
import urlparse
params = urlparse.parse_qs('chd=s%3AaUXKPnmomsWw0tSQnXaVrk%2CslrjjuZtXvZotualhrmepm')
chd = params['chd'] # 's:aUXKPnmomsWw0tSQnXaVrk,slrjjuZtXvZotualhrmepm'
The s: at the front means use the simple encoding. In that encoding, the characters A-Za-z0-9 are mapped to values 0-61 in a, well, simple manner:
def _get_simple_value(c):
  if c == '_':
    return None
  if 'A' <= c <= 'Z':
    return ord(c) - ord('A')
  if 'a' <= c <= 'z':
    return 26 + ord(c) - ord('a')
  if '0' <= c <= '9':
    return 52 + ord(c) - ord('0')
  raise ValueError('invalid character for simple encoding: {0}'.format(c))
Here the underscores _ indicate missing or null values. With this function, recovering the original data from the chd param is a quick one-liner:
data = [map(_get_simple_value, s) for s in chd[2:].split(',')]By default, the simple encoding maps onto an effective range of 1-100, so the last step is to normalize this and zip() the lists into pairs:
def fitSimpleToRange(x, xmin, xmax):
  if x is None:
    return None
  nx = x / 61.0
  return (1.0 - nx) * xmin + nx * xmax

points = zip(
  [fitSimpleToRange(x, 0, 100) for x in data[0]],
  [fitSimpleToRange(y, 0, 100) for y in data[1]]
)
Done! I've packaged this up as chdecode, which also deals with the Basic Text and Extended Encoding formats.
Let's See Those Charts Again #
You can see the code for this analysis here.
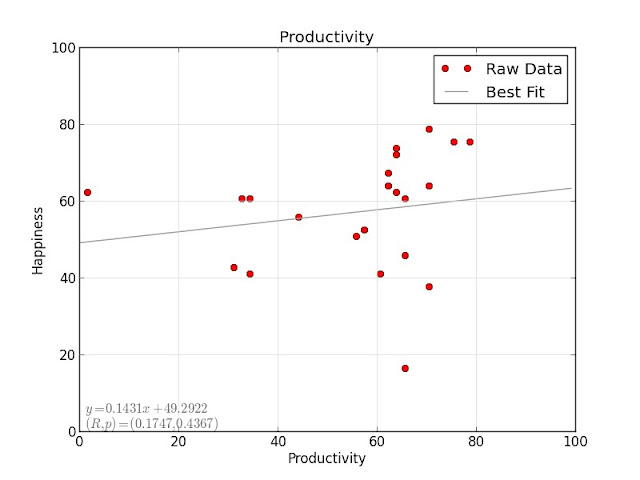
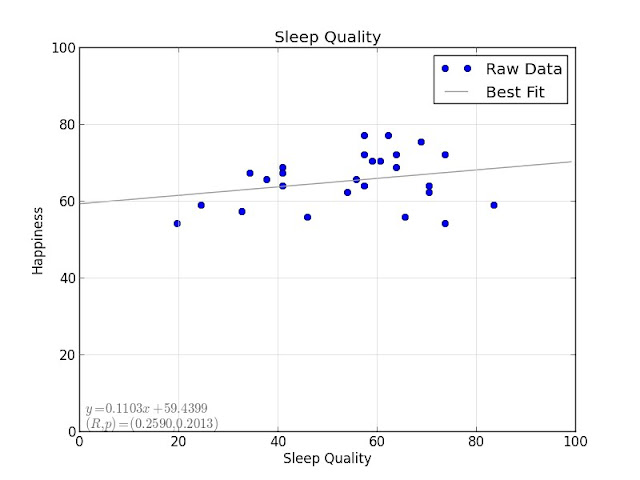
Focus, productivity, and sleep quality all have minor positive correlations with happiness:
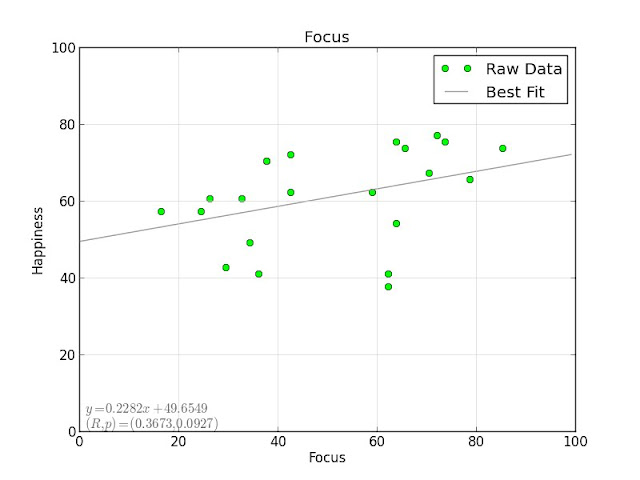
The most significant one is focus, but with $ p = 0.0927 $ it doesn't quite make the 5% significance threshold.
Up Next #
This ends my series of posts on data collection and analysis for dealing with panic disorder. In my next few posts, I'll talk about my plans for future experiments.
- Next: Don't Hate, Cross-Correlate
- Previous: Fitbit: APIs, crossfilter, and d3.js