Don't Hate, Cross-Correlate
In this post, I discuss cross-correlation. Although commonly used in signal processing, cross-correlation can be useful in a Quantified Self context. I'll present a bit of the mathematics behind cross-correlation, demonstrate a quick example, and briefly explain where you might use this in analyzing your personal data.
The Inspiration #
I was going through my Google Reader queue this morning and came across this talk by Jeff Zira, a product manager at Lark Technologies. The talk asks a simple question:
Do Jeff and his fiancée influence each other's sleep patterns?
He presents raw time-series sleep data collected using larklife, then attempts to answer this question in a couple of different ways. He first displays a timeline visualization of peak overnight activity:
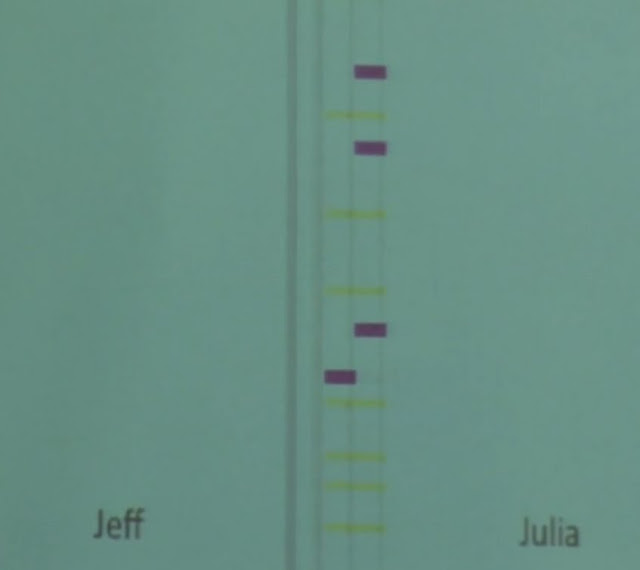
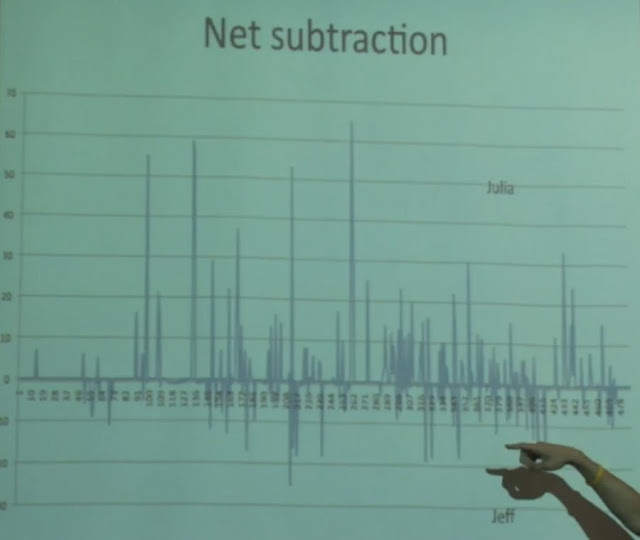
Since his peaks often occur slightly after her peaks, he uses this as evidence that she's waking him up. He also shows the difference signal between their sleep patterns, but finds this less than conclusive:
After watching this talk, I immediately thought:
Is there a more precise way to answer this question?
The Mathematics #
Note that term difference signal above. Any time-series dataset is a signal, which means the powerful tools of signal processing can be applied!
Let the sleep patterns of Jeff and his fiancée be the signals $ S(\tau) $ and $ T(\tau) $ respectively. Let $ f(S(\tau), T(\tau)) $ be the similarity between those signals. Ignoring (for now) the fact that $ f $ remains undefined, I'm looking for the time shift $ t $ that maximizes
$$
f(S(\tau + t), T(\tau))
$$
As a side note, the difference signal is a new signal $ R(\tau) = S(\tau) - T(\tau) $.
First, however, I need a reasonable similarity function $ f $. The answer lies in cross-correlation:
In signal processing, cross-correlation is a measure of similarity of two waveforms as a function of a time-lag applied to one of them.
Perfect! The core of cross-correlation is an integral that looks suspiciously like convolution, except that we have a term $ T(\tau + t) $ instead of $ T(\tau - t) $:
$$
(S \star T)(t) = \int_{-\infty}^{\infty} S^{\ast}(\tau) T(\tau + t) \mathrm{d}\tau
$$
The desired $ t $ is the global maximum of this cross-correlation function.
Given two discrete periodic signals S1, S2 of equal length, this cross-correlation integral can easily be computed:
function crossCorrelation(S1, S2, t) {
  var N = S1.length;
  t = t % N;
  if (t < 0) {
    t += N;
  }
  for (var tau = 0; tau < N; tau++) {
    C += S1[tau] * S2[(tau + t) % N];
  }
  return C / N;
}
It can be hard to visualize what this is doing, though, so I've provided a quick demo below.
An Interactive Example #
If you're viewing this on an RSS reader, check out the example on my blog.
You can see the code for this demo here.
Use the select boxes to change the red and blue functions. Click and drag on the chart at top to see how sliding the blue function affects the cross-correlation. Try different combinations of functions and see where the cross-correlation is maximized!
Back To The Original Motivation #
Given the two sleep signals $ S, T $ above, cross-correlation makes it possible to answer these questions:
- Who wakes up first? By how long?
- Accounting for the time shift in awakening, how closely do the sleep patterns match?
This gives a more rigorous sense of whether the peaks in nighttime activity actually do coincide. It also identifies the person who wakes up first and how much earlier they wake up.
While simply looking at the data can be very effective, rigorous analysis has definite value if you plan to carry out further experiments. Armed with cross-correlation data, you can answer questions like
Okay, I switched to a separately-coiled mattress. How well does that prevent us from waking each other up?
In general, signal processing techniques can be highly useful in examining time-series data.
Up Next #
This was a slight diversion from my plan to talk about upcoming experiments, which I'll return to in my next few posts. If you just can't wait, here's a quick summary:
- Persistent location tracking: by constantly tracking my location, I'll have an additional dataset to correlate against.
- Diet: by taking meal photos, tagging foods, and measuring stress levels after meals, I'll get a better idea of how different foods affect me.
- Finances: by tracking where Valkyrie and I spend our money, we'll hopefully be able to better control our discretionary spending.
- Loss Aversion: by experimenting with tracking methods, I'll see if this is something that can be meaningfully tracked over time.